Overview
Task Metrics provide high-level Business Analysis Chart Tools to drill down into tasks or navigate up in the process's status analysis. Task Metrics have four drill-down levels of valuable information to navigate and explain to the users their current working status when using ProcessMaker.
Note: The Task Metrics are global. They include all the cases in the workflow instance.
Requirements
- ProcessMaker version 3.7.x or higher.
Supported Stacks
The stacks supported by this feature are the same as those supported in ProcessMaker version 3.7. See this documentation to view the stacks supported by ProcessMaker.
Browser Compatibility
The browsers supported by this feature are the same as the features supported by ProcessMaker version 3.7. To view the browsers supported, check the following documentation.
Task Metrics Interface
The Task Metrics contain the following elements:
-
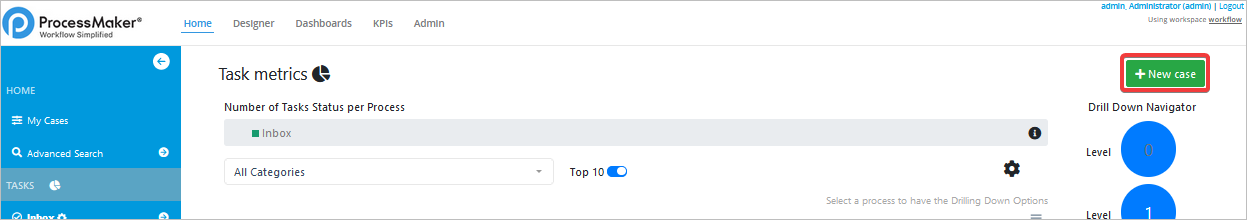
New Case button: Similar to other Inbox options, the + New Case button, located at the top-right corner, is available to start a new case.
-
Title, filters and graphics: Depending on the Drill level, the content of this section changes.
-
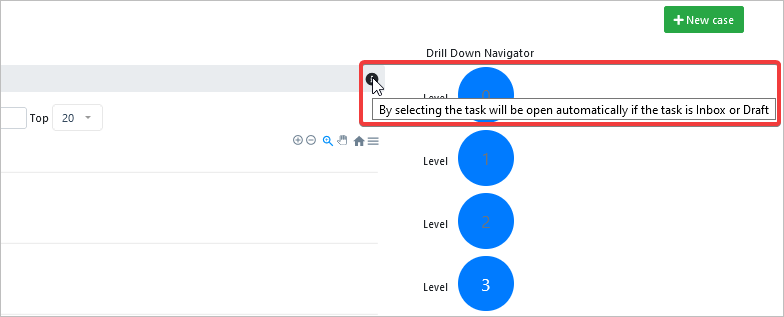
Current Drill Level: The selected level displays a white-colored number. After clicking any level, it displays the corresponding information to the level selected. The drill levels display a blue-colored circle.
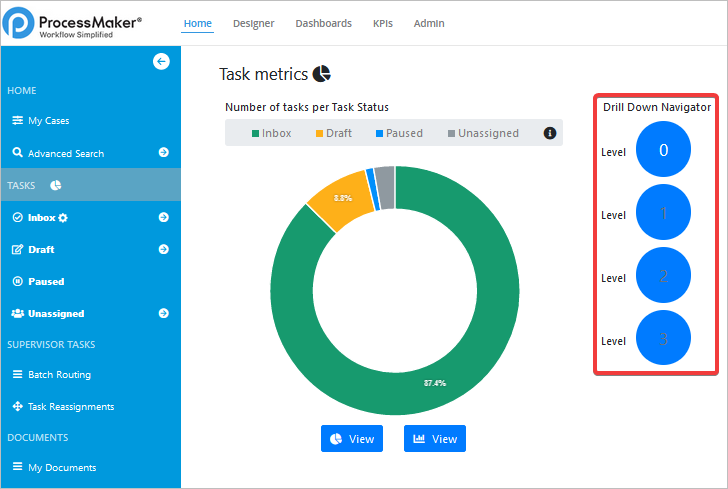
Task Metrics Drill Levels
The Task Metrics contain the following levels, these are explained in the sections below:
Task Metrics drill levels automatically save maintaining the searching criteria of the dashboard navigation.
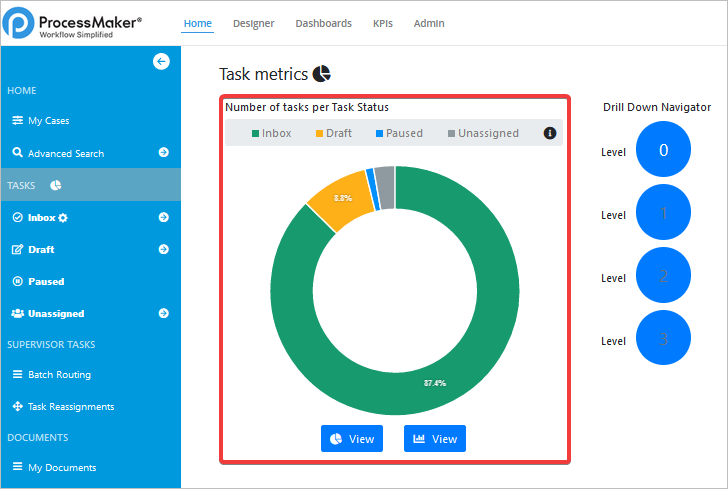
Drill Level Zero
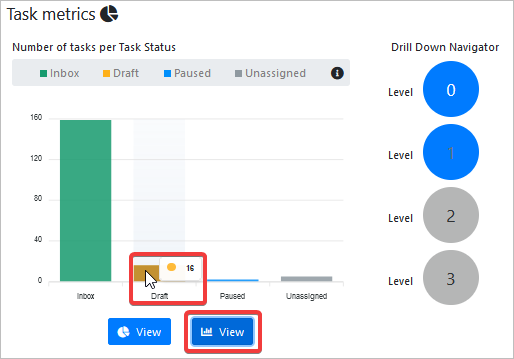
After selecting this Task Metric, the option is highlighted. The following list explains the properties and the values of the Drill Level Zero:
-
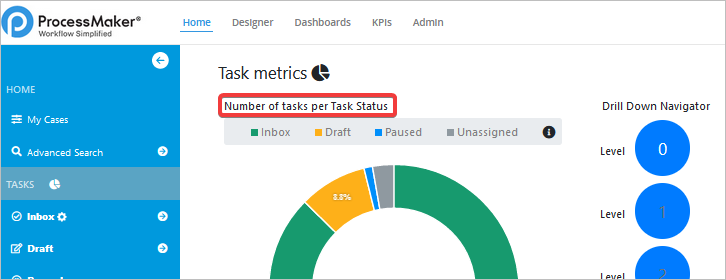
Chart Business Analysis Name Title: The title is Number of tasks per Task Status.
-
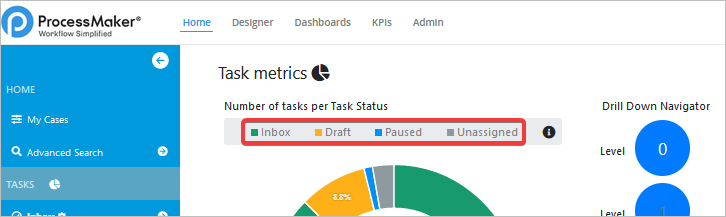
Case Status Links: Each Status is a link. After clicking any status, it drills to Level One and then displays the corresponding processes cases status chart.
-
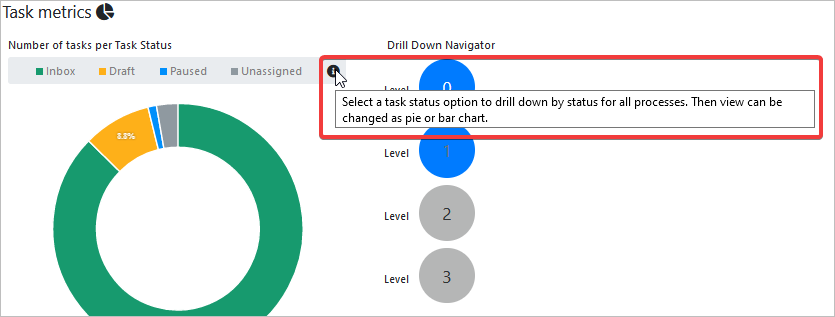
Case Status Tooltip: The information tooltip describes the Drilling and Options within the Chart navigation.
-
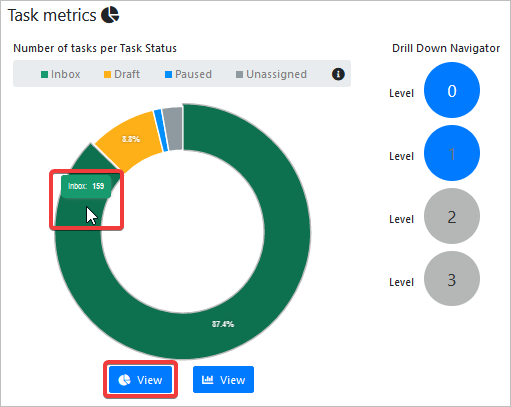
Chart Types: Doughnut Chart and Horizontal Bar Chart are available on this section. After hovering a chart section the number of the processes cases and their status display.
Drill Level One
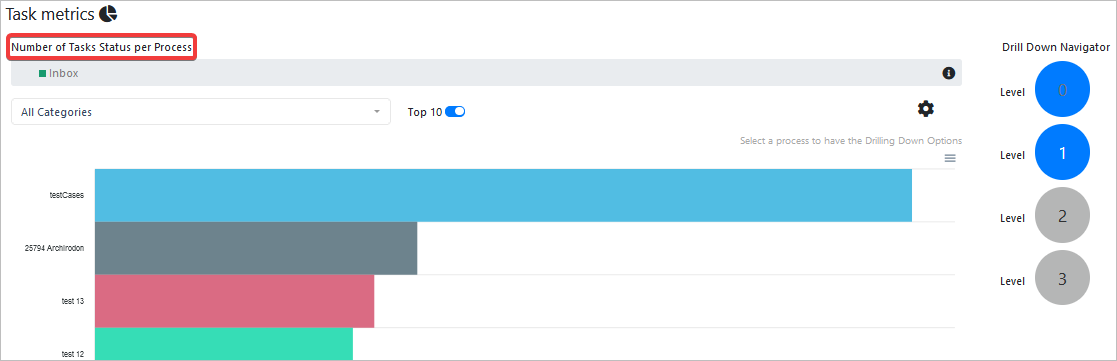
After selecting this Task Metric, the option is highlighted. The following list explains the properties and the values of the Drill Level One:
-
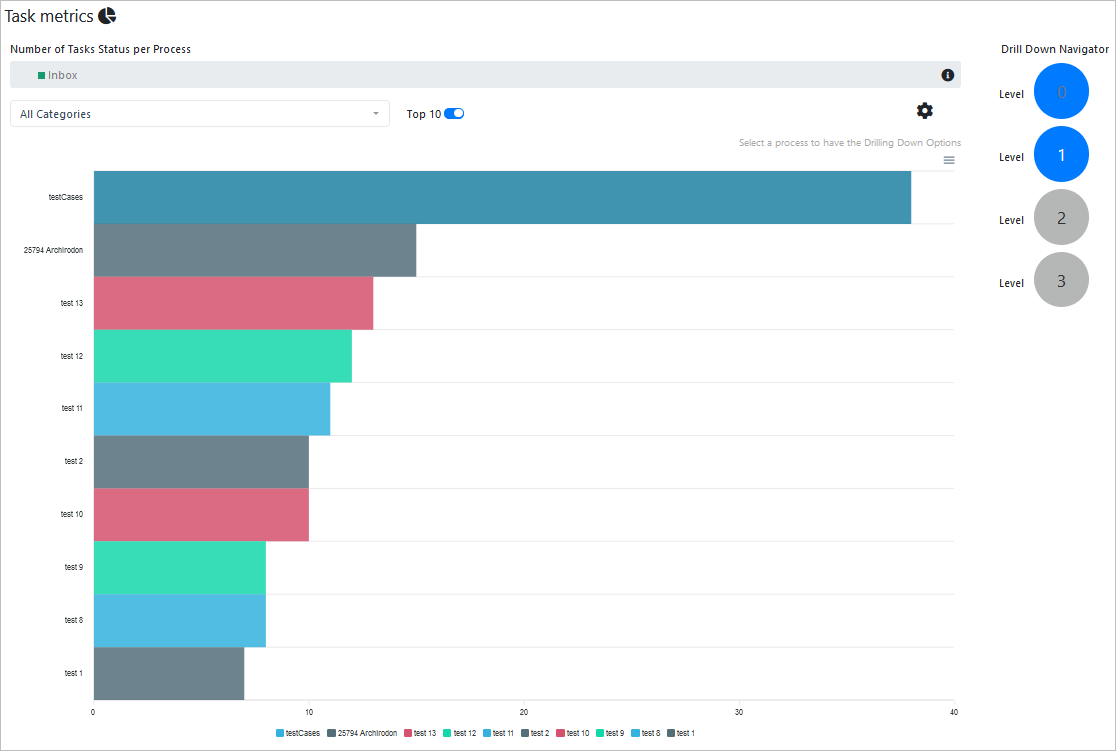
Chart Business Analysis Name Title: The title is Number of Tasks Status per Process.
-
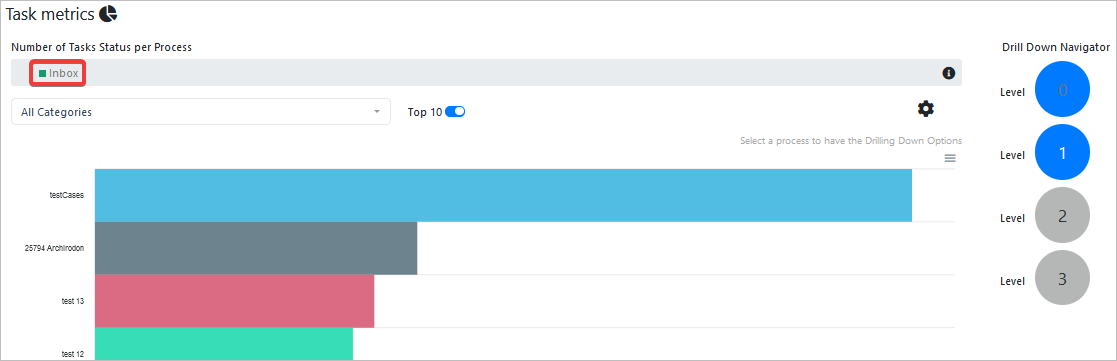
Case Status Selected: The selected case status displays.
-
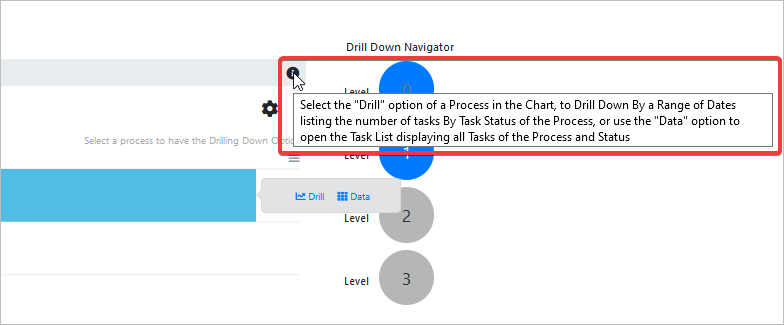
Case Status Tooltip: The information tooltip describes the Drilling and Options within the Chart navigation.
-
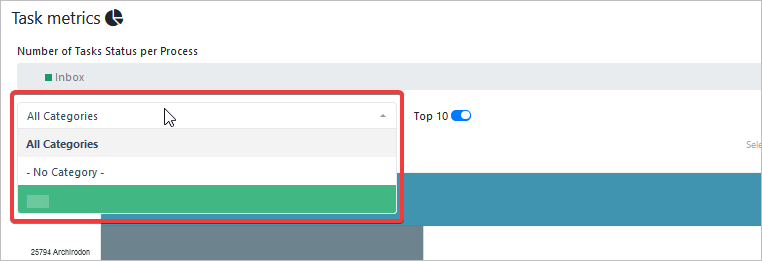
Categories Dropdown: The configured Process categories display in the list. When selecting any, it filters the processes cases and updates the chart automatically.
-
Top Ten Checkbox: When selected, the chart with the ten processes that have more cases display.
-
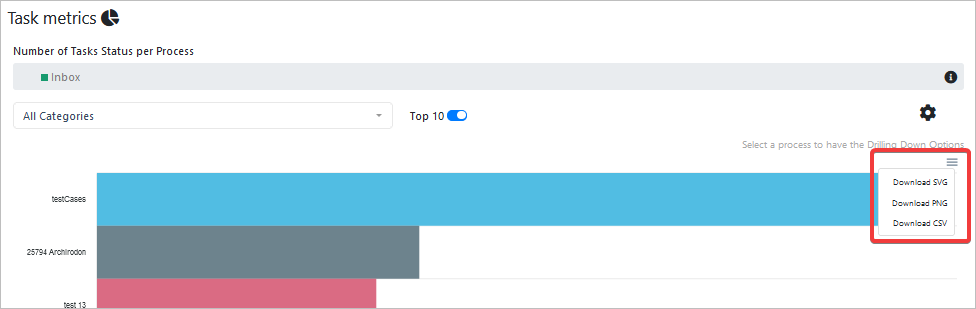
Download Data: When clicking the menu icon, the options to download information of the chart display.
-
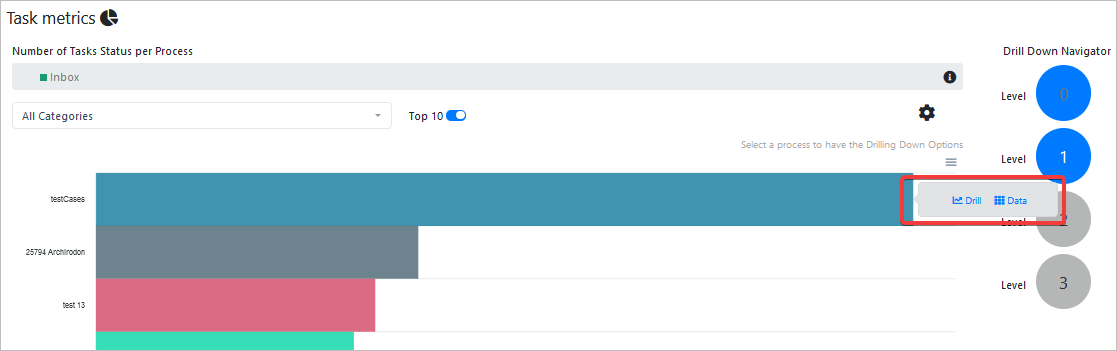
Drilling Down Options: Click a bar and then two links appear. The Drill link redirects and display information about the process cases in Drill Level Two. The Data link redirects to the Inbox and it applies a filter by Process Name.
Drill Level Two
After selecting this Task Metric, the option is highlighted. The following list explains the properties and the values of the Drill Level Two:
-
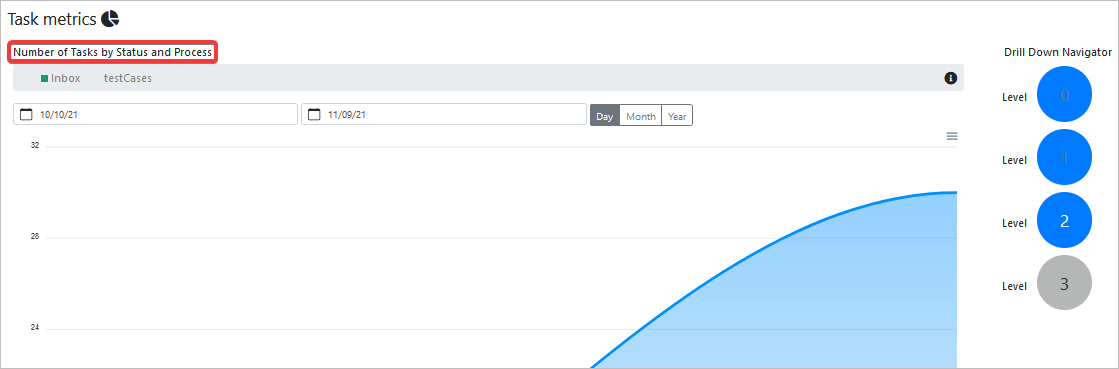
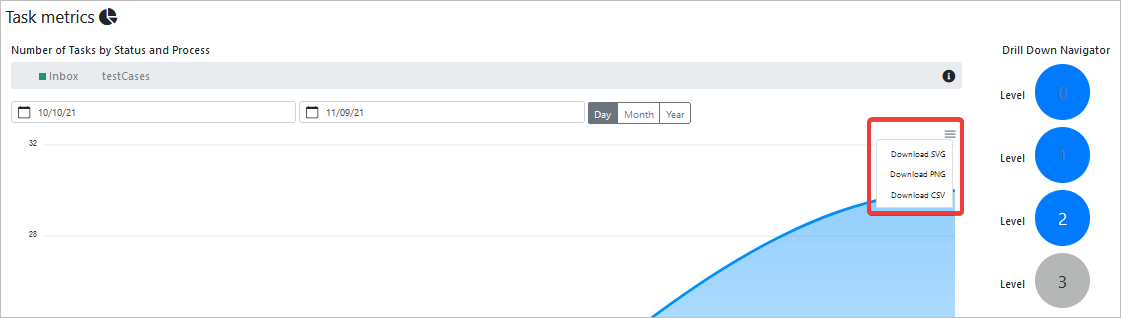
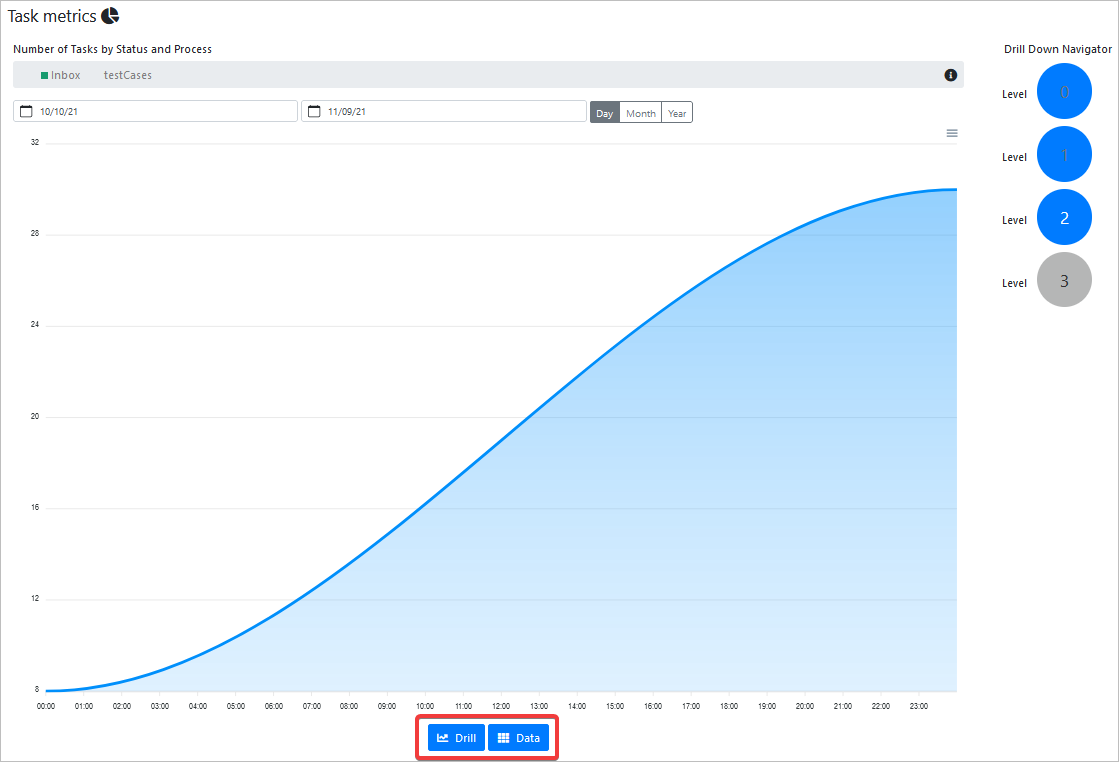
Chart Business Analysis Name Title: The title is Number of Tasks by Status and Process.
-
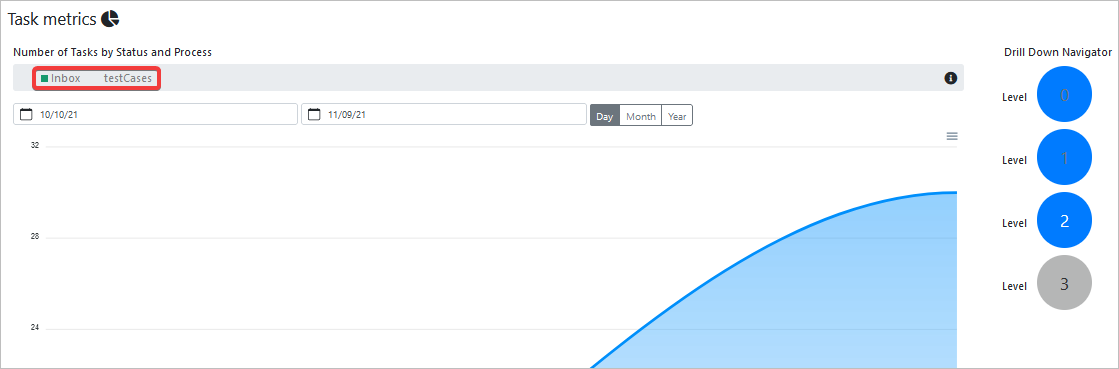
Case Status And Process Selected: The selected case status and process display.
-
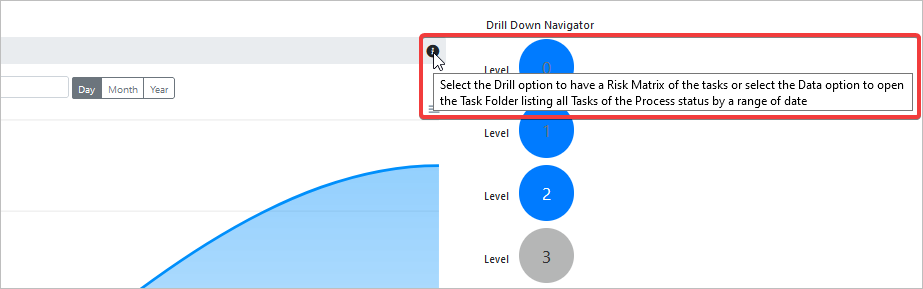
Case Status Tooltip: The information tooltip describes the Drilling and Options within the Chart navigation.
-
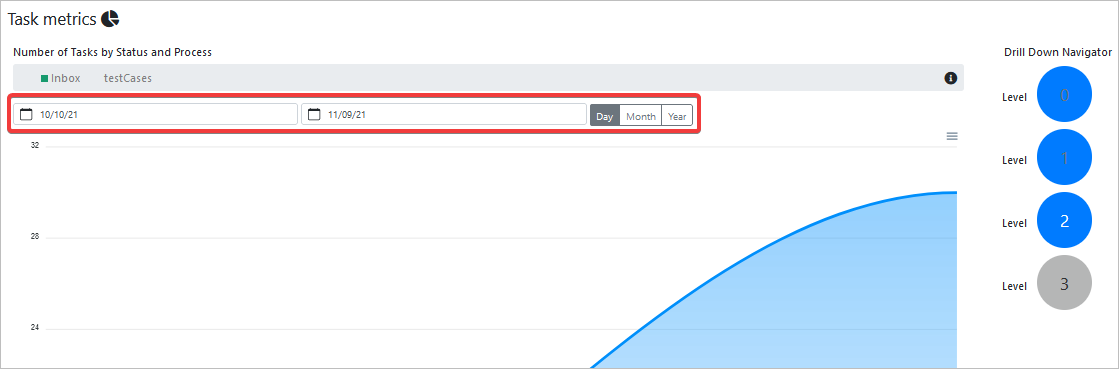
Date Filters: Chart displays the data according to the range date selected, and then by Day, Month or Year.
-
Download Data: When clicking the menu icon, the options to download information of the chart display.
-
Drilling Down Options: The two links appear below the chart. The Drill link redirects and display information about the Process's cases in Drill Level Three. The Data link redirects to the Inbox and it applies a filter by Process Name and Status.
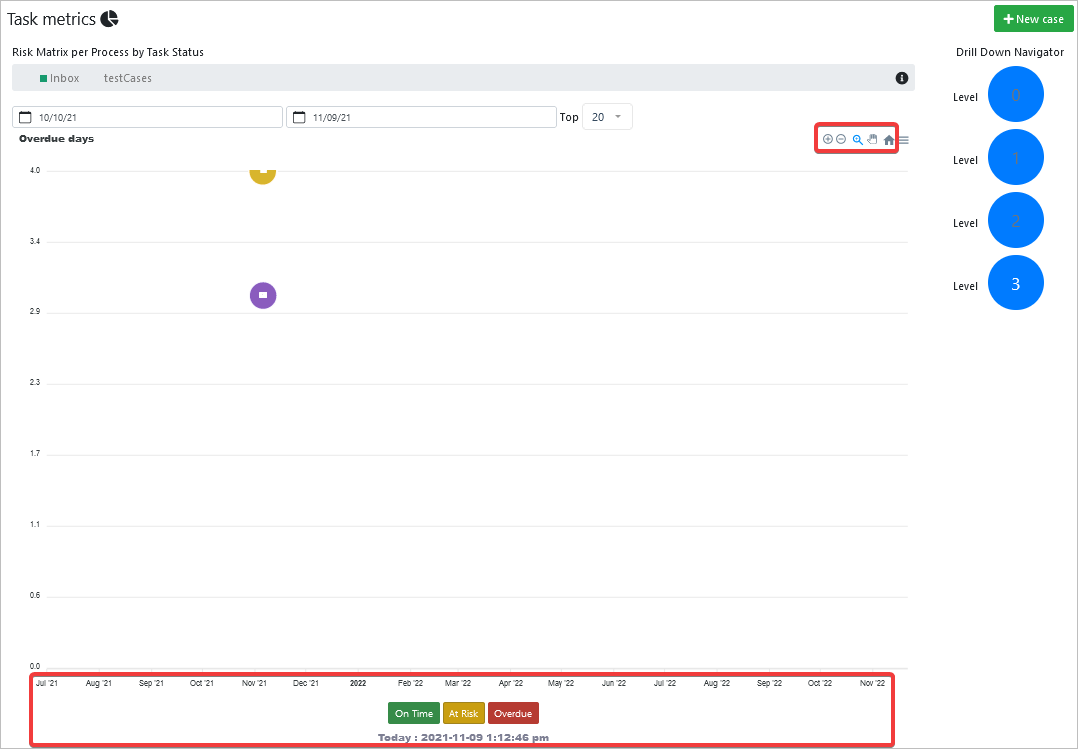
Drill Level Three
After selecting this Task Metric, the option is highlighted. The following list explains the properties and the values of the Drill Level Three:
-
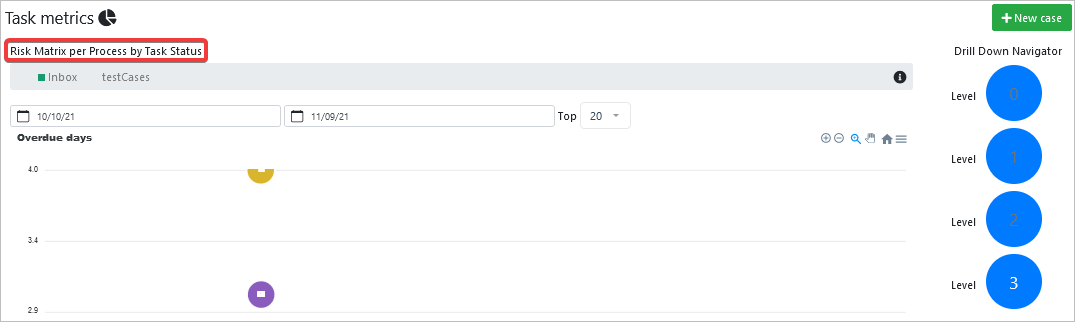
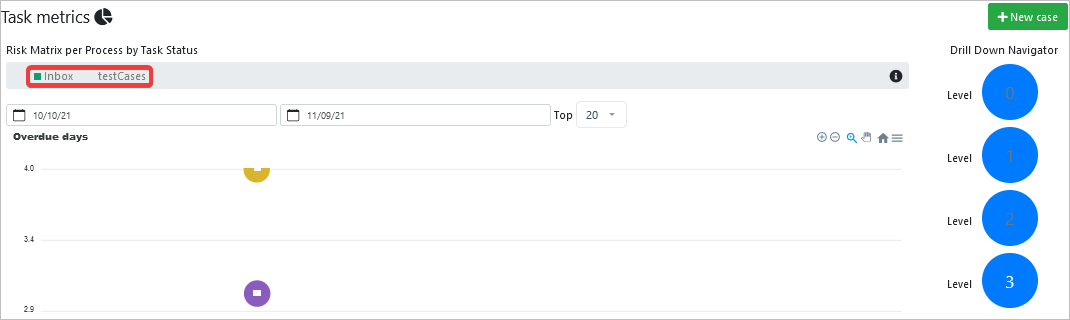
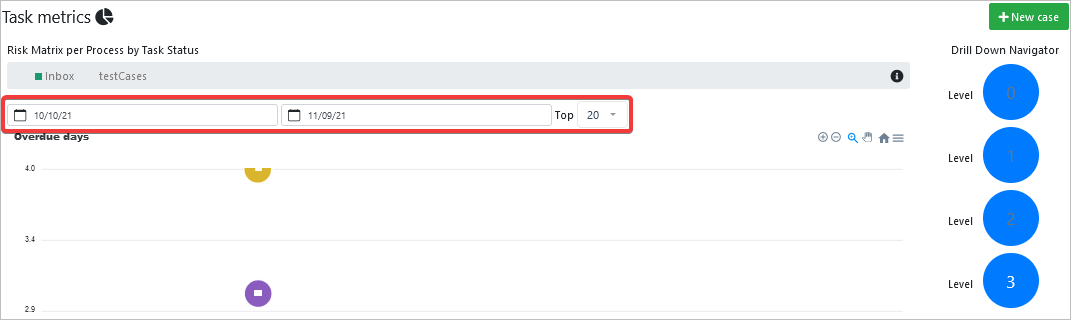
Chart Business Analysis Name Title: The title is Risk Matrix per Process by Task Status.
-
Case Status And Process Selected: The selected case status and process display.
-
Case Status Tooltip: The information tooltip describes the Drilling and Options within the Chart navigation.
-
Date Range Filter And Top Dropdown: Chart displays the data according to the range date selected, and then by amount from 10 up to 50.
-
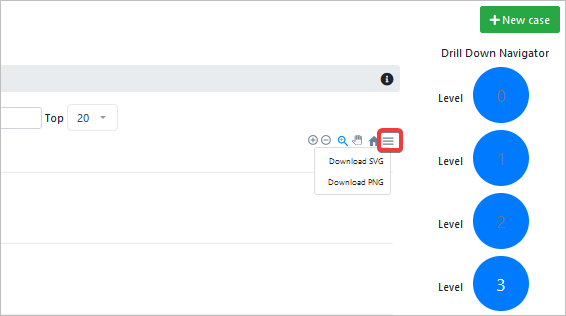
Download Data: When clicking the menu icon, the options to download information of the chart display.
-
Zoom Chart Options: When clicking any of these options, the chart changes the dates in the X axis. This is helpful to identify more cases between dates.
Note: Dates use the Data Base Time.