Overview
The ProcessMaker dashboard provides realtime monitoring of the efficiency and productivity of processes and users executing those processes. Managers and supervisors can use the dashboard to check up on the productivity of employees and measure how well departments are functioning. Dashboards are essential for gauging the effectiveness of a process and figuring out to improve it in the future. One of the goals of good Business Process Management (BPM) is continuous process improvement, which can only be achieved through effective measuring and monitoring.
The native Dashboard feature is only available in ProcessMaker version 2.0.34 and later.
Characteristics
This is defined as a ratio that is an indicator measured in percentage of the number of completed cases. The advantage is that this dashlet can be calculated for a predefined period of time.
The periods of time availables are:
- Today, yesterday, this week, previous week, previous month, this month, this year, and previous year.
Dashlets are created by the administrator and he is the person who assign each dashlet by department and to create or assign the user for whom dashboard will be available.
Another characteristics are colors, each color represents a range:
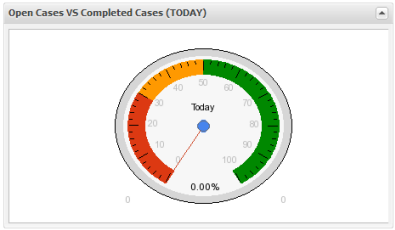
- RED: Most of the cases are open and need to be worked on.
- ORANGE: A few of the cases are open.
- GREEN: Most of cases are completed.
In future releases more colors will be added.
Creating a Dashlet
To create a new Dashlet instance, go to ADMIN > Settings > Dashboard:
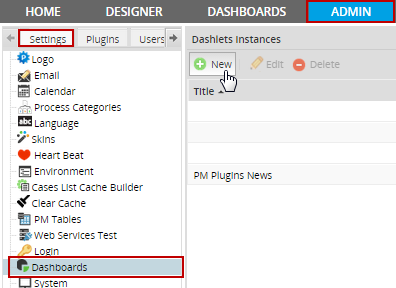
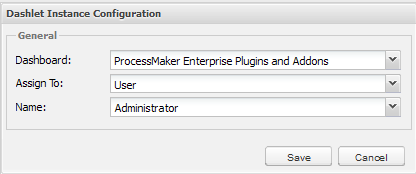
Click on New to create a new Dashlet Instance. The following window will be displayed to define the new Dashlet:
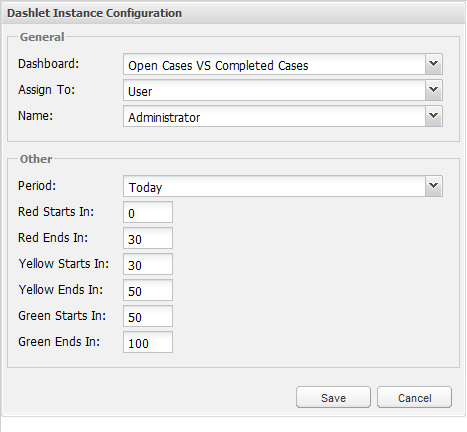
Where:
General
- Dashboard: Select the dashlet which will generate a report.
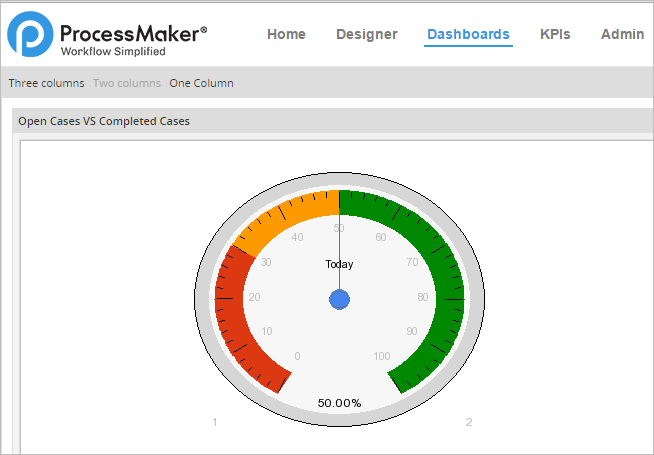
- Open Cases vs Completed Cases: Displays all the open cases vs the completed cases of the process. This option will display an Other section to define additional information.
- ProcessMaker Community: Displays links for the Community, Blog, Wiki, Forum, etc.
- ProcessMaker Enterprise Plugins and Addons: Displays all the information of the new plugins and addons available.
- Simple RSS reader: Displays the news from an RSS feed.
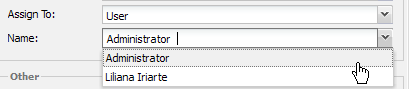
- Assign To: Select which user(s) can view the dashboard:
- User: An individual user can be assigned to see the Dashboard. By selecting this option, a list of the available users for the current process will be displayed:
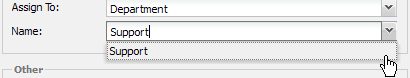
- Department: A department can be assigned to see the Dashboard. By selecting this option, a list of the available departments for the current process will be displayed:
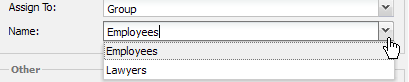
- Group: A group can be assigned to see the Dashboard. By selecting this option, a list of the available groups for the current process will be displayed:
- Everyone: The dashboard will be displayed to all users.
Other
- Period: Shows the period of time calculated for each dashlet. For example, if This year is selected, the Dashlet will show all the open and completed cases for the current year.
- Red Starts in: Number where the open cases begin must be defined.
- Red Ends in: Number where the open cases end must be defined.
- Yellow starts in: Number where the few open cases begin must be defined.
- Yellow ends in: Number where the few open cases end must be defined.
- Green starts in: Number where the completed cases begin must be defined.
- Green ends in: Number where the completed cases end must be defined.
Once the dashlet is created, and depending on the user, group or departament assign to have acces to it,go to tab DASHBOARD and the final report will be created:
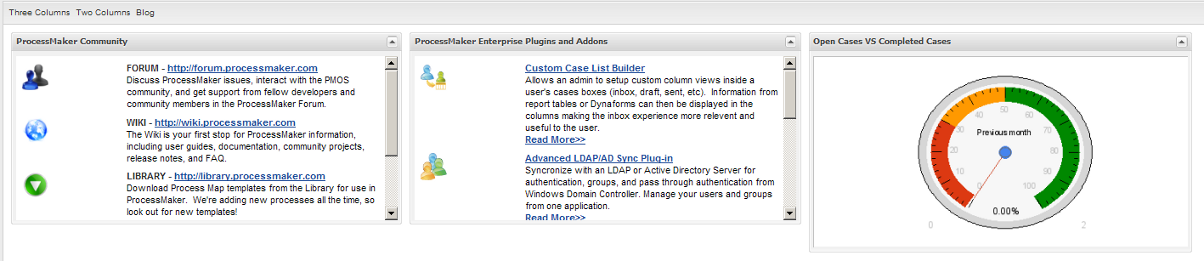
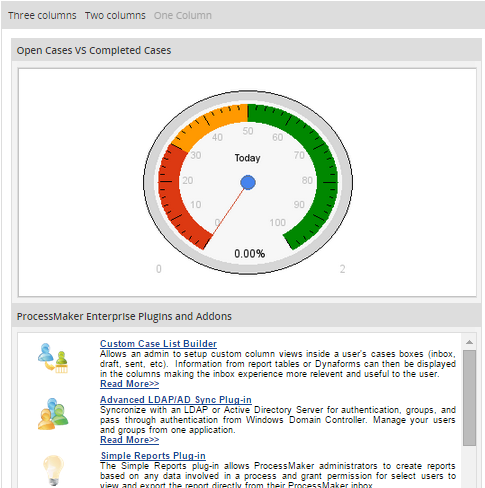
If the options "ProcessMaker Community" and/or "ProcessMaker Enterprise Plugins and Addons" were chosen on the DASHBOARD tab will display:
Editing a Dashlet
To edit a Dashlet's properties, click on the dashlet in the list to select it, then click the Edit button.
Deleting a Dashlet
To delete a Dashlet, choose the one to delete and then click on Delete.
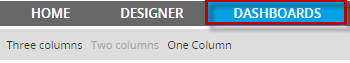
Dashboard View
There are three options to view Dashlets:
- Three Columns: The Dashlets are displayed in three columns as shown in the image below:
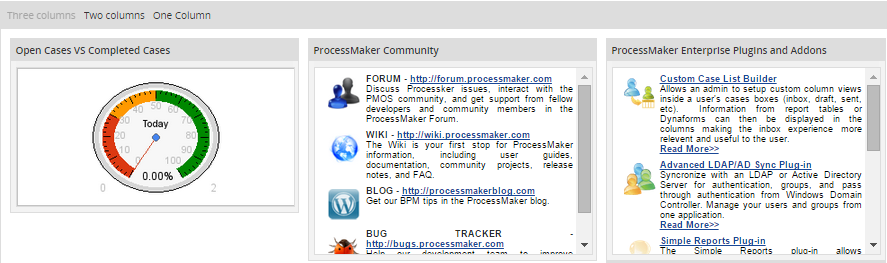
- Two Columns: The Dashlets are displayed in two columns as shown in the image below:
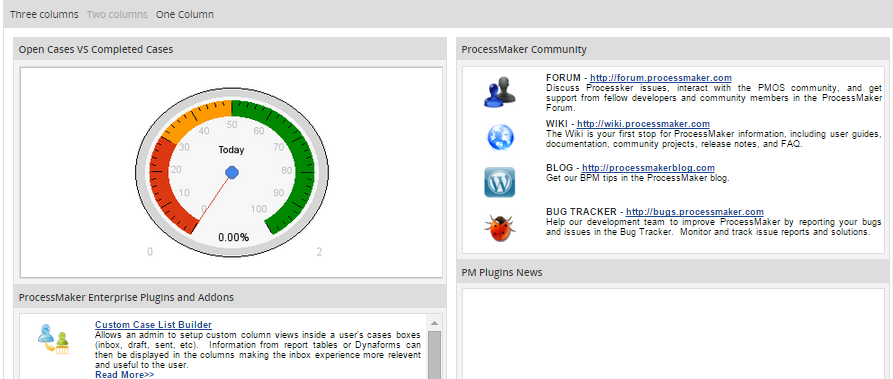
- One Column: The Dashlets are displayed in one column, one after another:
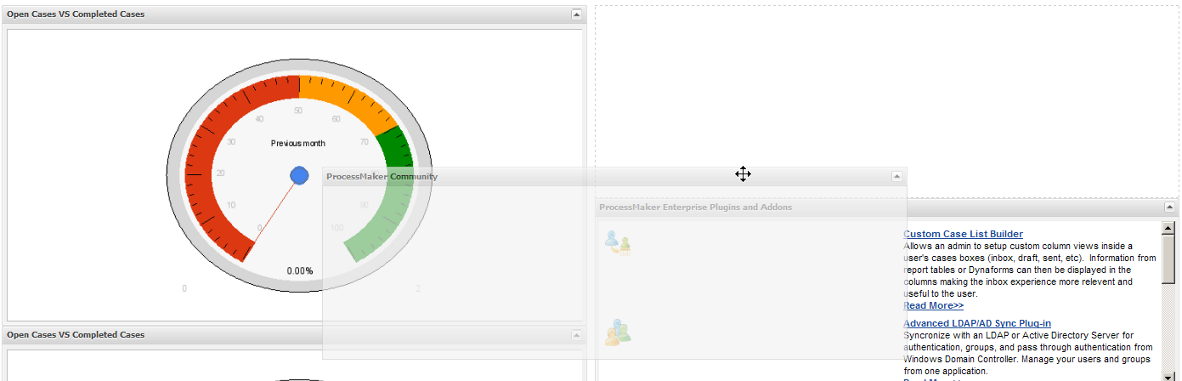
Drag & Drop Dashlets
A Dashlet can be moved by grabbing it and dragging it to a different location:
Saving Dashlet position
Available Version: From 2.5
On previous version of ProcessMaker when a Dashlet was moved its place was not saved. From this version if a dashboard is moved and users switch tabs and/or logout and then return to the dashboards its place and changes will be saved. This position will be configured by user.
Dashlets Instance List
To see a list of available Dashlets, go to ADMIN > Settings > Dashboards.
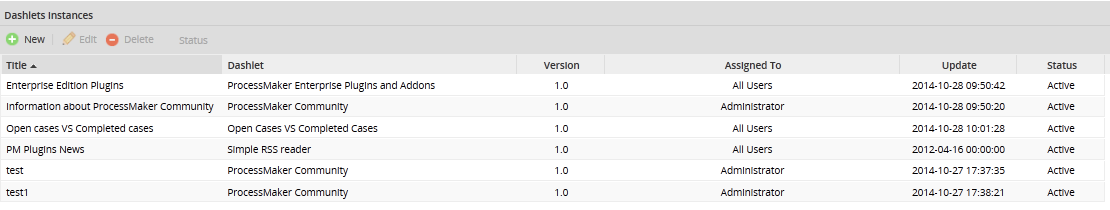
The following information is displayed about the Dashlets:
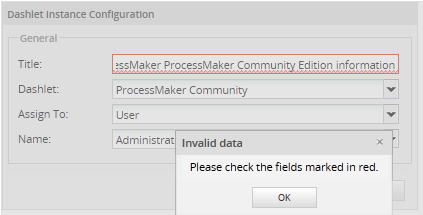
- Title: Give the dashlet instance a name.
- This field accepts only 201 characters among numbers, letters, and special characters.
- If more than 201 characters are introduced, the field will be highlighted in red and if trying to save it the following message will display: Available Version: 2.8 .
- In addition, if the title has spaces between sentences, the text will be adjusted in different lines: Available Version: 2.8 .
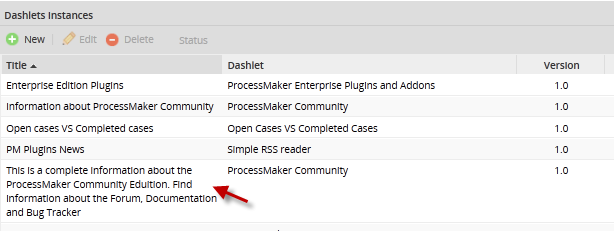
- Moreover, find the title sorted in descending order. Available Version: 2.8 .
- Dashlet: The name of the Dashlet.
- Version: The version of the Dashlet.
- Assigned to: The person who is assigned to see the created Dashlet.
- Update: The date when the Dashlet was lasted created or modified.
- Status: The status of the Dashlet: Active or Inactive.

