Release Notes | Downloadable version
![]() Plugin Version: 2.0.20
Plugin Version: 2.0.20
Introduction
New Relic is an application performance monitoring system that displays live information about ProcessMaker to customers and Support staff.
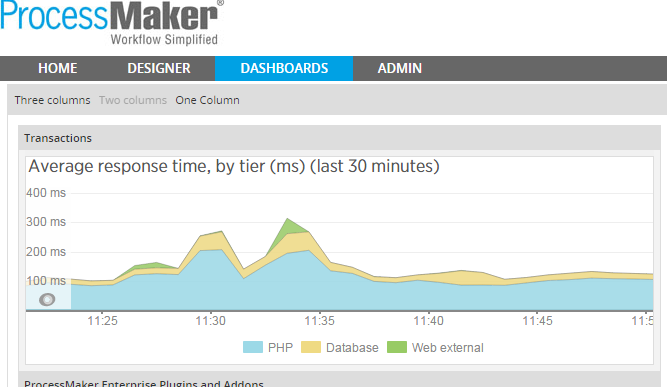
The New Relic plugin brings live charts from New Relic directly to the ProcessMaker Dashboards - implementing a very simple but useful integration.
This integration allows ProcessMaker System Administrators to monitor their server's information and performance through the application integrated inside ProcessMaker.
Requirements
ProcessMaker Requirements
- ProcessMaker v2.0.45 or higher (stable version + available hotfix)
- Enterprise Plugin v2.0.17 or higher (stable version + available hotfix)
Browser Requirements
- Internet Explorer 9 or higher
- Firefox 15 or higher
- Chrome v31.0.1636.2,
- HTML5 supported browser
How the plugin works
The New Relic plugin allows ProcessMaker to have a real time monitoring where users can determine what is happening on their systems in response to performance issues or problem reports; in addition, it helps to find bottlenecks that some applications or systems may have.
What you can do with this Plugin:
- Create a new instance that will allow you to monitor activity of your server.
- Create a dashlet so you can add a new instance.
- Monitor (real time) all the activity in your server.
Benefits:
- Allows real time monitoring, so companies can determine what is happening on their systems in response to performance issues or problem reports.
- Helps companies find bottlenecks that some applications or systems may have.
- Allows to monitor activity from inside ProcessMaker without the need to go to the new relic instance.
which must be separately installed and configured.
Installation and Configuration
- Import the New Relic plug-in on the ADMIN tab.
- Enabled the Plug-in.
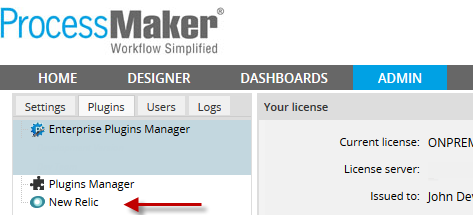
- The plug-in New Relic will add an option inside ADMIN > Plugins option:
Creating a new instance
To create a new instance which will allow to monitor some activity of our server(s), go to ADMIN > Settings option and click on New Relic option:

A list with all New Relic instance will display, click on New to create a new one:

Where:
- Title: Specify the title of the new instance.
- URL: Address where new relic is installed. The URL field only accept links from the domain *.newrelic.com
Click on Submit and the new instance will display on the main list:

Creating a dashlet
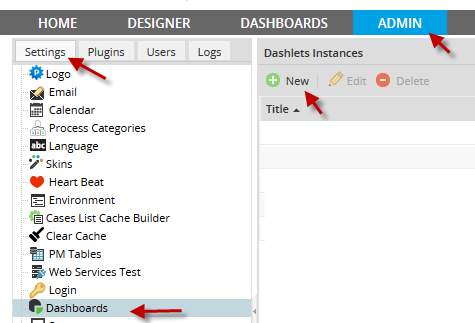
To create a dashlet go to Dashboards option inside ADMIN > Settings and click on New:
Click on New, the following pre-filled information will display, where it is clear that a new instance has been created:
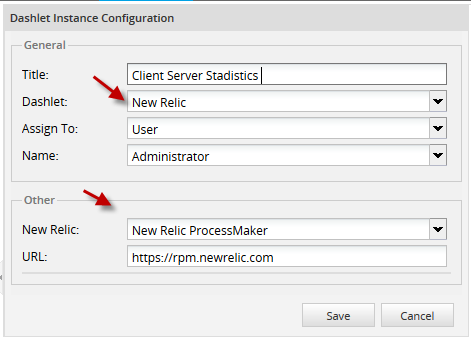
Where:
General Section
- Title: Give New relic dashlet a title which will display inside DASHBOARDS tab.
- Dashlet:There is a list of available dashlets in the community version, New Relic dashlet has been added to this list.
- Assign to: select person or group dashlet will be visible:
-
- User: This option allows the view only to one user. If this option is selected automatically all users created inside this workspace will be listed on the Name field:

-
- Department: Choose the department which has the option to see the dashlet created. As soon as a department is chosen the Name field all available departments for the current workspace will be listed.
-
- Group: Choose a group which will have the option to see the dashlet created. As soon as a department is chosen the Nme field all available groups for the current workspace will be listed.
-
- All: All users will have the option to see the dashlet created.
Other Section
- New Relic: Select the New Relic instance created before.
- URL:: According to the instance previously created, the URL where the New Relic server is located will display. This URL can't be modified, but if needed, edit it where the the new instance was previously created.
Once the New Relic dashlet was created, it will list on the Dashlet Instance:

Real User Monitoring
If needed to monitor specific information, login to New Relic and look for the chart with the required information, for example:
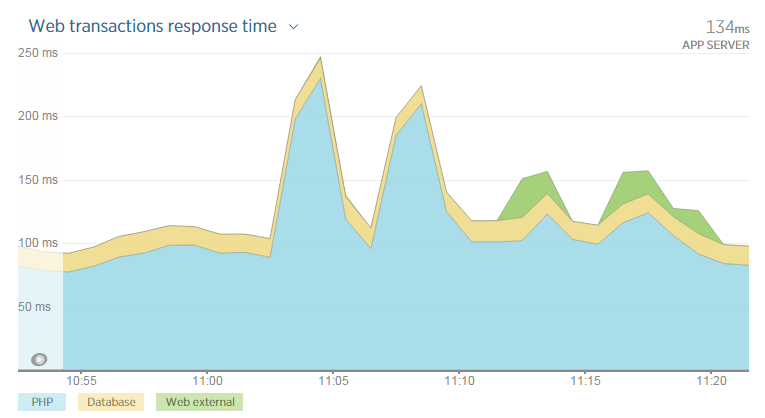
To include only this chart inside ProcessMaker, click on the plus icon, located under the chart:
![]()
A sub menu will display, click on Embed to get the information about the chart:

Copy the URL provided:

Create a new instance and paste the URL inside the URL field:

Save changes and go to DASHBOARDS tab, the new dashlet will appear:
